
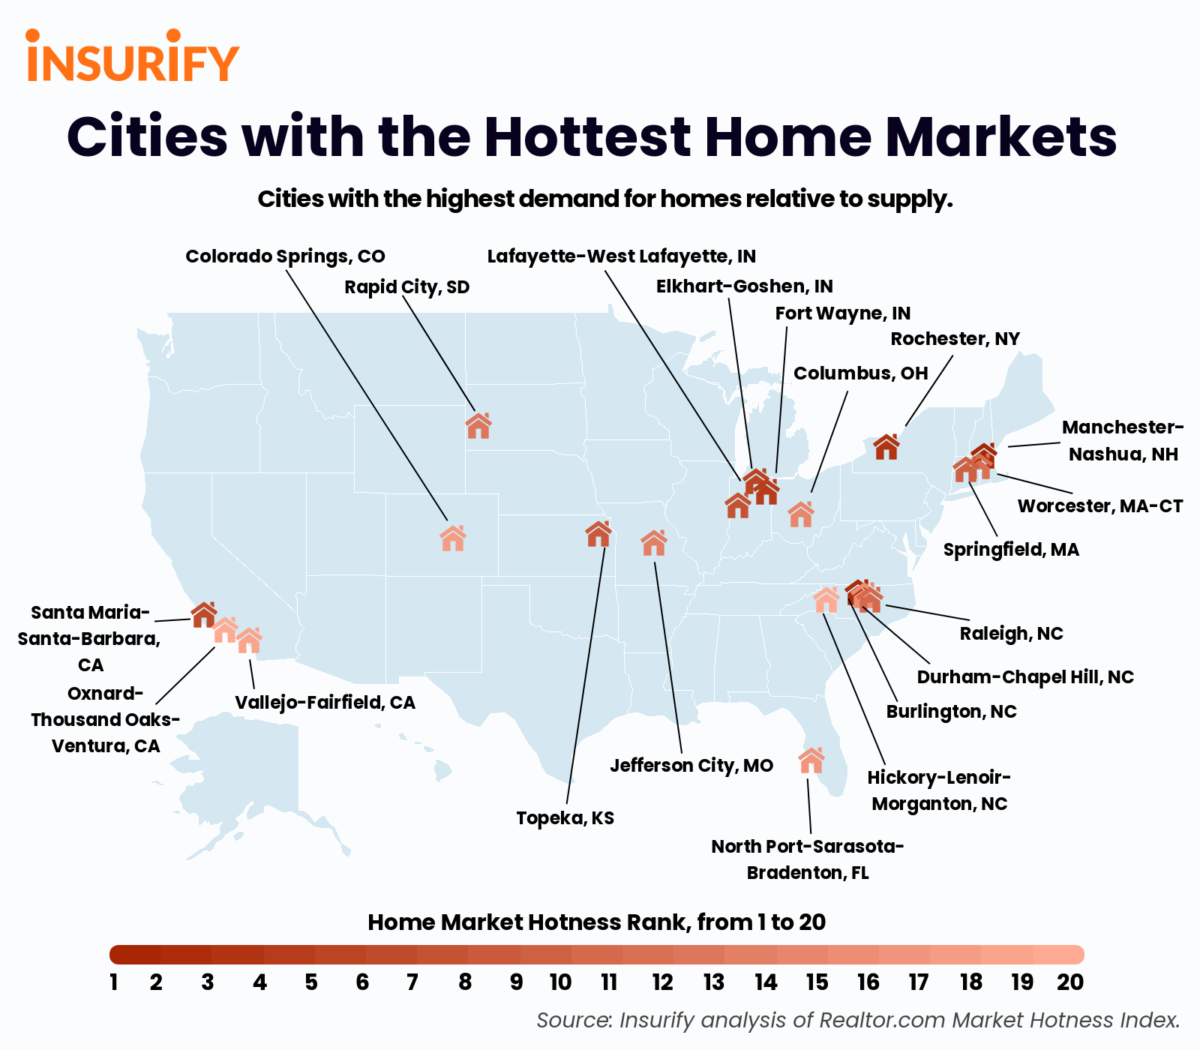
Hottest Real Estate Markets (2022)
Real estate is hot across the country, and these twenty cities are starting off the year on fire.
In 2022, housing markets across the U.S. are still experiencing the unprecedented demand that arose during the early stages of the pandemic nearly two years ago. According to the National Association of Realtors, home values increased by 16.9% in 2021, the highest year-over-year increase since 1999. This elevated demand is pressuring waning real estate supply, with no sign of stopping in the new year, as the median American home sales price hit a new record high of $358,000 in December.
Home availability and affordability affects practically every prospective homebuyer in America, so the data scientists at Insurify sought to identify the housing markets soaring highest at the start of the new year. Insurify’s research team referred to national real estate data to determine the twenty hottest home markets in 2022.
Insights
- National averages. The median listing price of a home in the United States is $361,423, a full 10% higher than it was at the beginning of 2021. Homes are also selling 16% faster than they were a year ago, with the median house spending just 47.7 days on the market.
- Hot market homes are selling at record speeds. Even as houses across the country are flying off the market, homes in the twenty hottest real estate markets are selling at unbelievable speeds. The average home in the twenty hottest cities spends just 34.7 days on the market—barely more than a month! This sale rate is a whopping 29% faster than the average rate everywhere else in the country.
- Big booms in smaller markets. The twenty hottest markets in the country are predominantly small to medium-sized metro areas. In fact, none of the thirty largest housing markets in the country make the list. Columbus, OH has the largest metro area among the twenty hottest markets with 2,138,926 residents, making it the thirty-second-largest metro area in the country, according to the 2020 U.S. Census.
Methodology
The data scientists at Insurify, a home insurance comparison site, referred to housing market data from Realtor.com to determine the cities with the hottest home markets in 2022. They evaluated cities based on Realtor.com’s Market Hotness Index, which scores each metropolitan area based on days on market and Realtor.com views per property. Cities received a Market Hotness Score from 1 to 100. Cities whose homes had fewer days on the market and higher views per property, indicative of higher demand, received a higher Market Hotness Score. On the other hand, metro areas whose homes had more days on the market and fewer views per property, indicative of a lower demand, received a lower Market Hotness Score.
Realtor.com compiles monthly data on these measures. In order to account for fluctuations month to month, the data scientists at Insurify took the average Market Hotness Score for each city over October, November, and December of 2021. They then used these average scores to identify the top twenty cities with the hottest home markets heading into 2022. Median home price data, median days on market, and year over year percent change for both were gathered from Realtor.com.
This study considered the 300 largest metropolitan areas in the United States.
The findings in this article represent statistical trends found in Insurify’s analysis of national real estate data. The findings of this study are not meant to imply the direction nor necessarily the existence of a causal relationship. Rather, this is a presentation of statistical correlations of public interest.

Which city has the hottest home market in 2022?
Manchester-Nashua, New Hampshire has the most booming real estate market in the country to start 2022. Not only is the median Manchester home selling for $427,000--18% greater than the national average--its homes are selling faster than ever. The median Manchester home spends just 31 days on the market, which is 35% less time than the average home nationally.
20 Cities With the Hottest Housing Markets in 2022
20. Hickory-Lenoir-Morganton, NC
- Home market hotness score: 80.0
- Median home listing price: $273,817 (24% less than the national average)
- Median days on market: 43.5 (9% less than the national average)
19. Oxnard-Thousand Oaks-Ventura, CA
- Home market hotness score: 80.4
- Median home listing price: $901,167 (149% greater than the national average)
- Median days on market: 38.5 (19% less than the national average)
18. Vallejo-Fairfield, CA
- Home market hotness score: 81.3
- Median home listing price: $594,333 (64% greater than the national average)
- Median days on market: 30.3 (36% less than the national average)
17. Colorado Springs, CO
- Home market hotness score: 81.6
- Median home listing price: $493,742 (37% greater than the national average)
- Median days on market: 29.7 (38% less than the national average)
16. North Port-Sarasota-Bradenton, FL
- Home market hotness score: 81.8
- Median home listing price: $500,400 (38% greater than the national average)
- Median days on market: 41.8 (12% less than the national average)
15. Durham-Chapel Hill, NC
- Home market hotness score: 83.6
- Median home listing price: $465,330 (29% greater than the national average)
- Median days on market: 35.7 (25% less than the national average)
14. Columbus, OH
- Home market hotness score: 83.8
- Median home listing price: $289,850 (20% less than the national average)
- Median days on market: 36.0 (25% less than the national average)
13. Jefferson City, MO
- Home market hotness score: 86.0
- Median home listing price: $185,617 (49% less than the national average)
- Median days on market: 37.2 (22% less than the national average)
12. Rapid City, ND
- Home market hotness score: 86.1
- Median home listing price: $376,400 (4% greater than the national average)
- Median days on market: 38.0 (20% less than the national average)
11. Worcester, MA-CT
- Home market hotness score: 87.5
- Median home listing price: $393,117 (9% greater than the national average)
- Median days on market: 37.0 (22% less than the national average)
10. Raleigh, NC
- Home market hotness score: 87.9
- Median home listing price: $423,300 (17% greater than the national average)
- Median days on market: 24.8 (48% less than the national average)
9. Springfield, MA
- Home market hotness score: 88.4
- Median home listing price: $311,483 (14% less than the national average)
- Median days on market: 35.2 (26% less than the national average)
8. Topeka, KS
- Home market hotness score: 88.6
- Median home listing price: $174,550 (52% less than the national average)
- Median days on market: 36.5 (24% less than the national average)
7. Lafayette-West Lafayette, IN
- Home market hotness score: 88.8
- Median home listing price: $226,600 (37% less than the national average)
- Median days on market: 35.5 (26% less than the national average)
6. Santa Maria-Santa Barbara, CA
- Home market hotness score: 89.2
- Median home listing price: $1,371,500 (279% greater than the national average)
- Median days on market: 37.8 (21% less than the national average)
5. Elkhart-Goshen, IN
- Home market hotness score: 90.4
- Median home listing price: $219,633 (39% less than the national average)
- Median days on market: 34.8 (27% less than the national average)
4. Fort Wayne, IN
- Home market hotness score: 91.2
- Median home listing price: $228,283 (37% less than the national average)
- Median days on market: 33.5 (30% less than the national average)
3. Rochester, NY
- Home market hotness score: 94.6
- Median home listing price: $203,300 (44% less than the national average)
- Median days on market: 29.3 (39% less than the national average)
2. Burlington, NC
- Home market hotness score: 96.2
- Median home listing price: $289,583 (20% less than the national average)
- Median days on market: 28.5 (40% less than the national average)
1. Manchester-Nashua, NH
- Home market hotness score: 97.2
- Median home listing price: $427,400 (18% greater than the national average)
- Median days on market: 31.0 (35% less than the national average)
If you have any questions or comments about this article or would like to request the data, please contact
More From K96 FM